
Most of them were on these roads
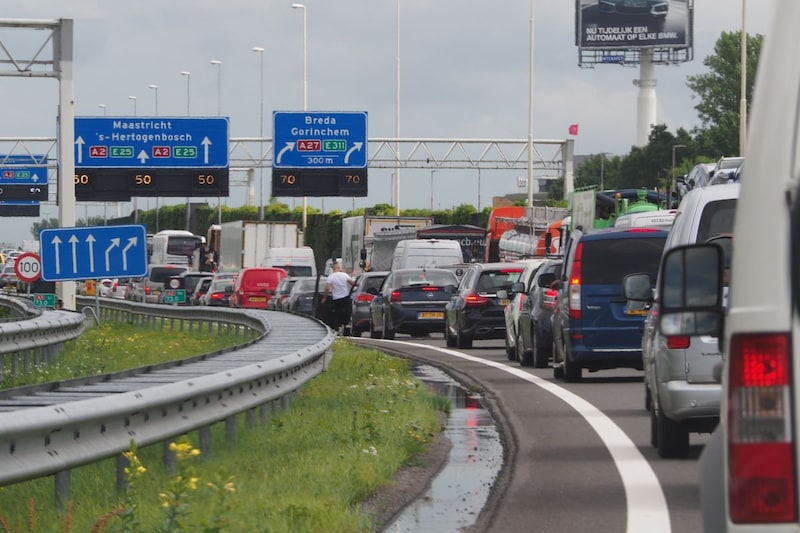
In the last three quarters of 2022, when there were no more corona measures, there were not as many traffic jams as in the same period of 2019. The pandemic therefore seems to have changed our workplace and times, so that the traffic jam pressure is lower for the time being . The number of traffic jams decreased, especially in the Randstad provinces. Which routes had the most traffic jams? You can find that information at the bottom of this article.
With 12 percent fewer traffic jams than in the same period of 2019, in Q2 to Q4 of 2022 (after the abolition of the covid-19 measures, that is) we almost returned to the level of traffic jams before the pandemic. Over the entire year there were still 20 percent fewer traffic jams than in 2019, but that is a poor comparison in connection with the measures that still applied in January, February and March of this year. To illustrate: in 2021 there were 57 percent fewer traffic jams than in 2019, in 2020 even 63 percent. The new values are the result of an analysis by the ANWB based on all congestion figures on A and N roads in 2022.
This shows that the number of traffic jams in rush hours in particular has increased since the measures were abolished. As usual, Tuesday and Thursday are the days with the busiest rush hours, and they were even busier this year than in 2019. On Mondays, on the other hand, it became a lot quieter during rush hour: on Monday mornings there were 40 percent fewer traffic jams in 2022 than in 2019. The moment when the morning rush hour is heaviest has also changed: previously it was often busiest on the road around 8 am, now it is around 9.30 am.
Fewer traffic jams in the Randstad
For many employers, working from home has become more important than before during the pandemic, and the traffic jam figures clearly show that. This is probably the reason why we experienced less traffic jams in Q2 to Q4 of 2022 than in 2019, despite the population growth in the meantime. In the period referred to, there were 26, 18 and 13 percent fewer traffic jams in Noord-Holland, Utrecht and Zuid-Holland respectively than in Q2 to Q4 of 2019.
In the tables below the top 10 congestion bottlenecks and the top 5 traffic jam bottlenecks on N-roads in 2022:
| Position | Highway and direction | Between |
| 1 | A27 Utrecht > Breda | Lexmond and Werkendam |
| 2 | A58 Tilburg > Eindhoven | Moergestel and Oirschot |
| 3 | A4 The Hague > Rotterdam | The Hague-South and Kethel tunnel |
| 4 | A15 Rotterdam > Gorinchem | Hendrik-Ido-Ambacht and Sliedrecht |
| 5 | A1 Apeldoorn > Amsterdam | Voorthuizen and Hoevelaken |
| 6 | A2 Utrecht > ‘s Hertogenbosch | Culemborg and Zaltbommel |
| 7 | A12 German border > Arnhem | German border and Arnhem |
| 8 | A4 Amsterdam > The Hague | Roelofarendsveen and Zoeterwoude |
| 9 | A20 Gouda > Hook of Holland | Junction Terbregseplein and Kleinpolderplein |
| 10 | A50 Arnhem > Eindhoven | Junction Valburg and Junction Bankhoef |
| Position | N road and direction | At / between |
| 1 | N206 Katwijk > Zoetermeer | Lead |
| 2 | N50, both directions | Struggling |
| 3 | N247 Amsterdam > Hoorn | Amsterdam and Volendam |
| 4 | N57 Rotterdam > Middelburg | Connection A15 and Hellevoetsluis |
| 5 | N242, both directions | Alkmaar |
– Thanks for information from Autoweek.nl